


How to find the best strategy for you ?

Value
Our factor investing score meticulously assesses the intrinsic value of each asset, providing invaluable insights into its potential for long-term growth.

Growth
With a keen focus on growth prospects, our factor investing score analyzes each asset's trajectory, offering strategic guidance for maximizing returns in dynamic market conditions..

Quality
With an emphasis on quality metrics, our factor investing score meticulously evaluates the fundamental strength and stability of each asset, safeguarding your portfolio against potential risks.

Volatility
By meticulously evaluating volatility, our factor investing score helps you navigate market turbulence, ensuring a balanced portfolio resilient to unpredictable fluctuations.

Momentum
Leveraging momentum analysis, our factor investing score identifies assets poised for upward trends, empowering you to capitalize on market momentum for optimized performance.

Yield
Focused on yield optimization, our factor investing score identifies assets with attractive income potential, enabling you to construct a diversified portfolio tailored to your income objectives.
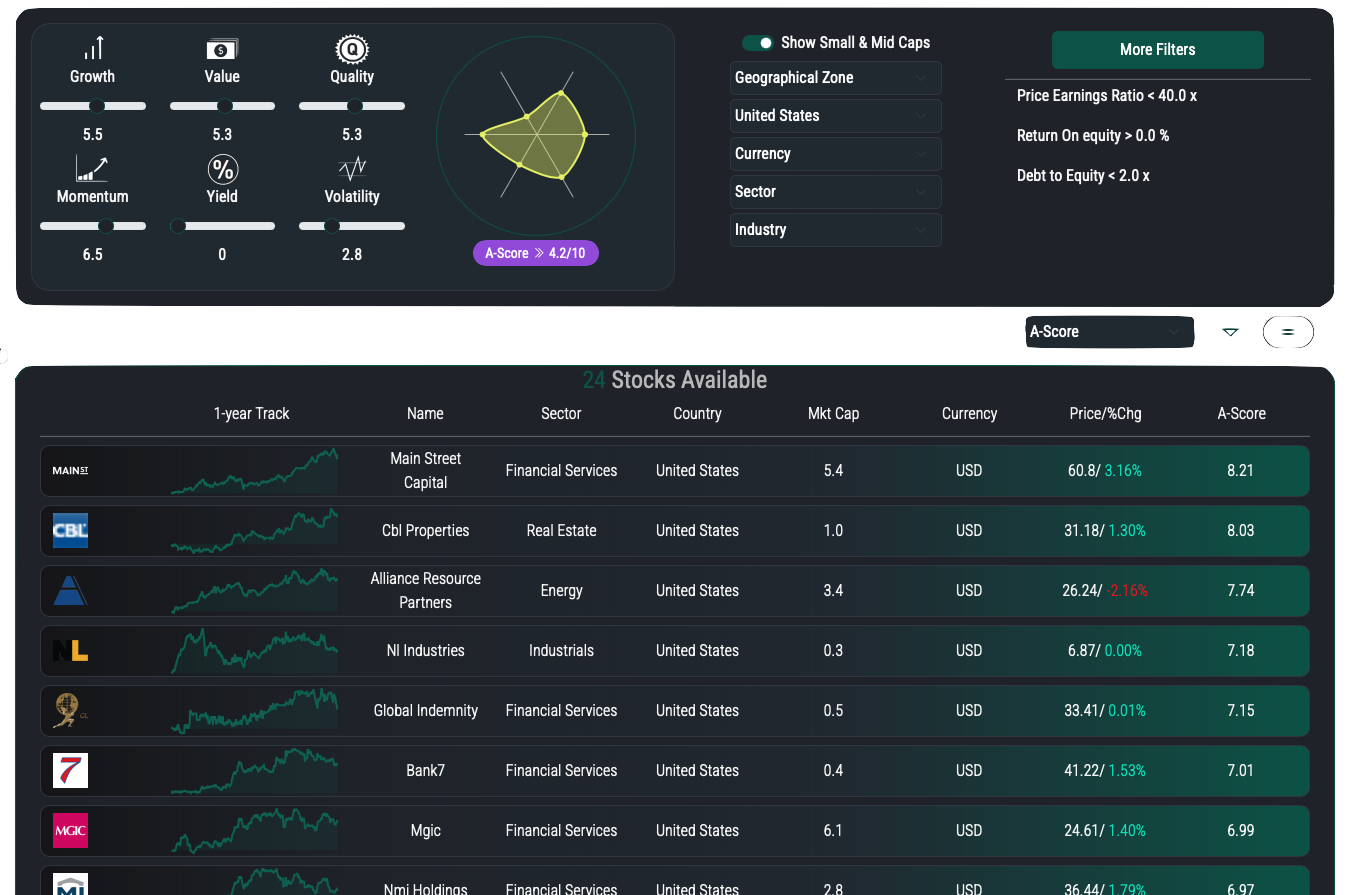
Create a reliable strategy with the A-Score
Undervalued company with stable and reliable business like Warren Buffet
Get detailled Investment Case for more than 5500 Stocks
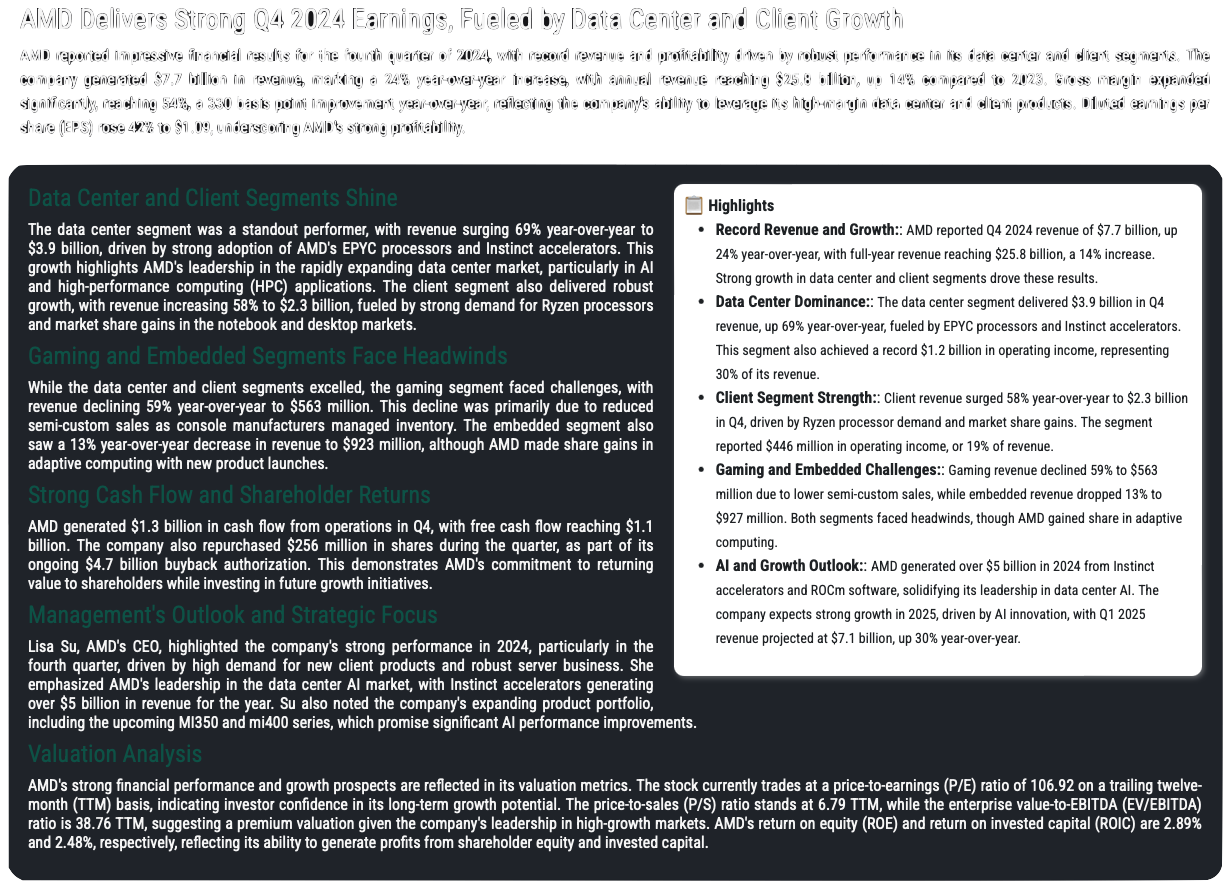
Strong Company Updates
Get a complete corporate access : reliable, clear, and always available at the time you need it

Flowers Foods(FLO): None
None
May -22

Copart(CPRT): None
None
May -21

Ross Stores(ROST): Ross Stores Rides Strong Q1 Surge to 21% Sales Growth
Ross Stores posted a robust first‑quarter performance, with total sales climbing 21% to $6.0 billion and earnings per share surging 37% to $2.02—well above the $1.73 estimate. Comparable store sales grew 17%, supported by a higher transaction volume and a broader customer base spanning all income levels, ethnicities, and age groups. Operating margin expanded 120 basis points to 13.4%, while merchandise margin improved 85 basis points and occupancy leveraged another 60 basis points. The company’s P/E of 32.34 reflects the market’s premium on its disciplined growth strategy.
May -21
Quality Equity Research. Easy Access
Get started with our cost-effective equity research
Monthly
Annual Up to 30% Discount
Free Trial
FREE
7 Days- Unlimited access to Watchlist
- Unlimited access to screener
- Unlimited access to AI Assistant
- Access to US Investment Case
- API calls limited to 10/day
- Request new coverage
- Premium Support
Premium
$39.99
per month
- Unlimited access to Watchlist
- Unlimited access to screener
- Unlimited access to AI Assistant
- Unlimited access to Investment Case
- API calls limited to 250/day
- Request new coverage
- Premium Support
Ultimate
$99.90
- Unlimited access to Watchlist
- Unlimited access to screener
- Unlimited access to AI Assistant
- Unlimited access to Investment Case
- API calls limited to 2500/minute
- Request new coverage
- Premium Support