Company Story
1930 - American Airlines is founded as a consolidation of 82 small airlines.
1934 - American Airlines introduces the DC-3, the first all-metal airliner.
1945 - American Airlines begins international service to Europe and Latin America.
1959 - American Airlines introduces the first transcontinental jet service.
1961 - American Airlines introduces the first electronic reservation system.
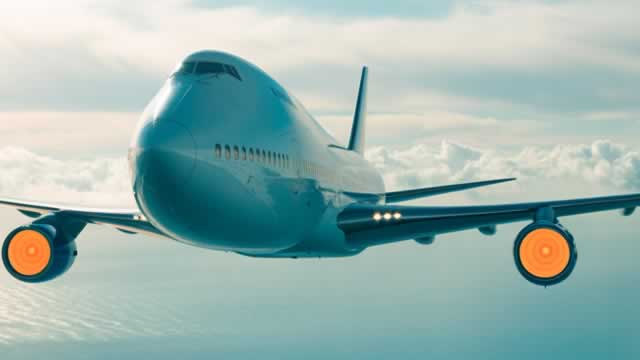
1970 - American Airlines introduces the Boeing 747 jumbo jet.
1981 - American Airlines introduces the AAdvantage frequent flyer program.
1990 - American Airlines acquires Eastern Air Lines.
2001 - American Airlines acquires TWA.
2011 - American Airlines files for Chapter 11 bankruptcy protection.
2013 - American Airlines merges with US Airways.
2015 - American Airlines completes its merger with US Airways.