Company Story
1968 - Darden Restaurants, Inc. was founded by Bill Darden in Orlando, Florida.
1970 - The first Red Lobster restaurant was opened in Lakeland, Florida.
1982 - Darden Restaurants, Inc. went public with an initial public offering (IPO).
1985 - The company acquired the Olive Garden Italian Restaurant chain.
1995 - Darden Restaurants, Inc. acquired the Smokey Bones BBQ & Grill chain.
2000 - The company launched its Bahama Breeze island-inspired restaurant chain.
2007 - Darden Restaurants, Inc. acquired the LongHorn Steakhouse chain.
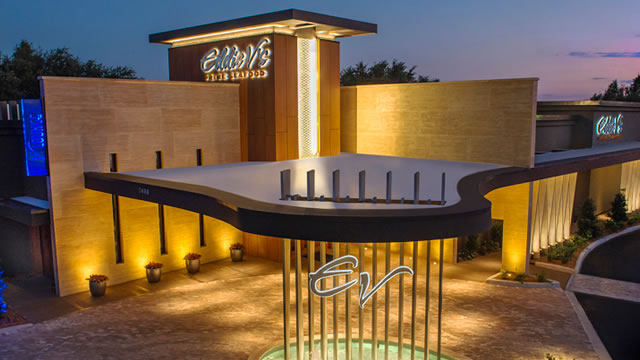
2011 - The company launched its Eddie V's Prime Seafood chain.
2014 - Darden Restaurants, Inc. spun off its Red Lobster chain into a separate company.
2015 - The company acquired the Cheddar's Scratch Kitchen chain.
2018 - Darden Restaurants, Inc. acquired the Chuy's Mexican restaurant chain.