Download PDF

1. Company Snapshot

1.a. Company Description

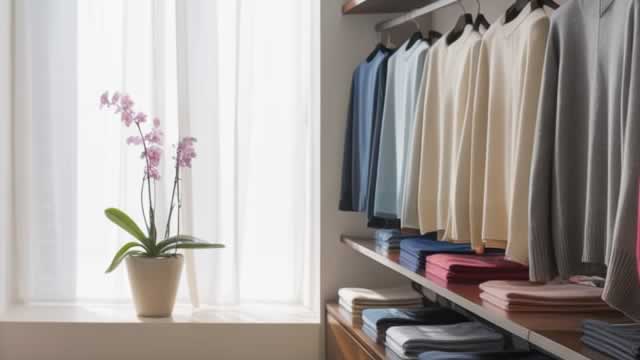
Ralph Lauren Corporation designs, markets, and distributes lifestyle products in North America, Europe, Asia, and internationally.The company offers apparel, including a range of men's, women's, and children's clothing; footwear and accessories, which comprise casual shoes, dress shoes, boots, sneakers, sandals, eyewear, watches, fashion and fine jewelry, scarves, hats, gloves, and umbrellas, as well as leather goods, such as handbags, luggage, small leather goods, and belts; home products consisting of bed and bath lines, furniture, fabric and wallcoverings, lighting, tabletop, kitchen linens, floor coverings, and giftware; and fragrances.It sells apparel and accessories under the Ralph Lauren Collection, Ralph Lauren Purple Label, Polo Ralph Lauren, Double RL, Lauren Ralph Lauren, Polo Golf Ralph Lauren, Ralph Lauren Golf, RLX Ralph Lauren, Polo Ralph Lauren Children, and Chaps brands; women's fragrances under the Ralph Lauren Collection, Woman by Ralph Lauren, Romance Collection, and Ralph Collection brand names; and men's fragrances under the Polo Blue, Ralph's Club, Safari, Purple Label, Polo Red, Polo Green, Polo Black, Polo Sport, and Big Pony Men's brand names.


The company's restaurant collection includes The Polo Bar in New York City; RL Restaurant in Chicago; Ralph's in Paris; The Bar at Ralph Lauren located in Milan; and Ralph's Coffee concept.It sells its products to department stores, specialty stores, and golf and pro shops, as well as directly to consumers through its retail stores, concession-based shop-within-shops, and its digital commerce sites.The company directly operates 504 retail stores and 684 concession-based shop-within-shops; and operates 175 Ralph Lauren stores, 329 factory stores, and 148 stores and shops through licensing partners.


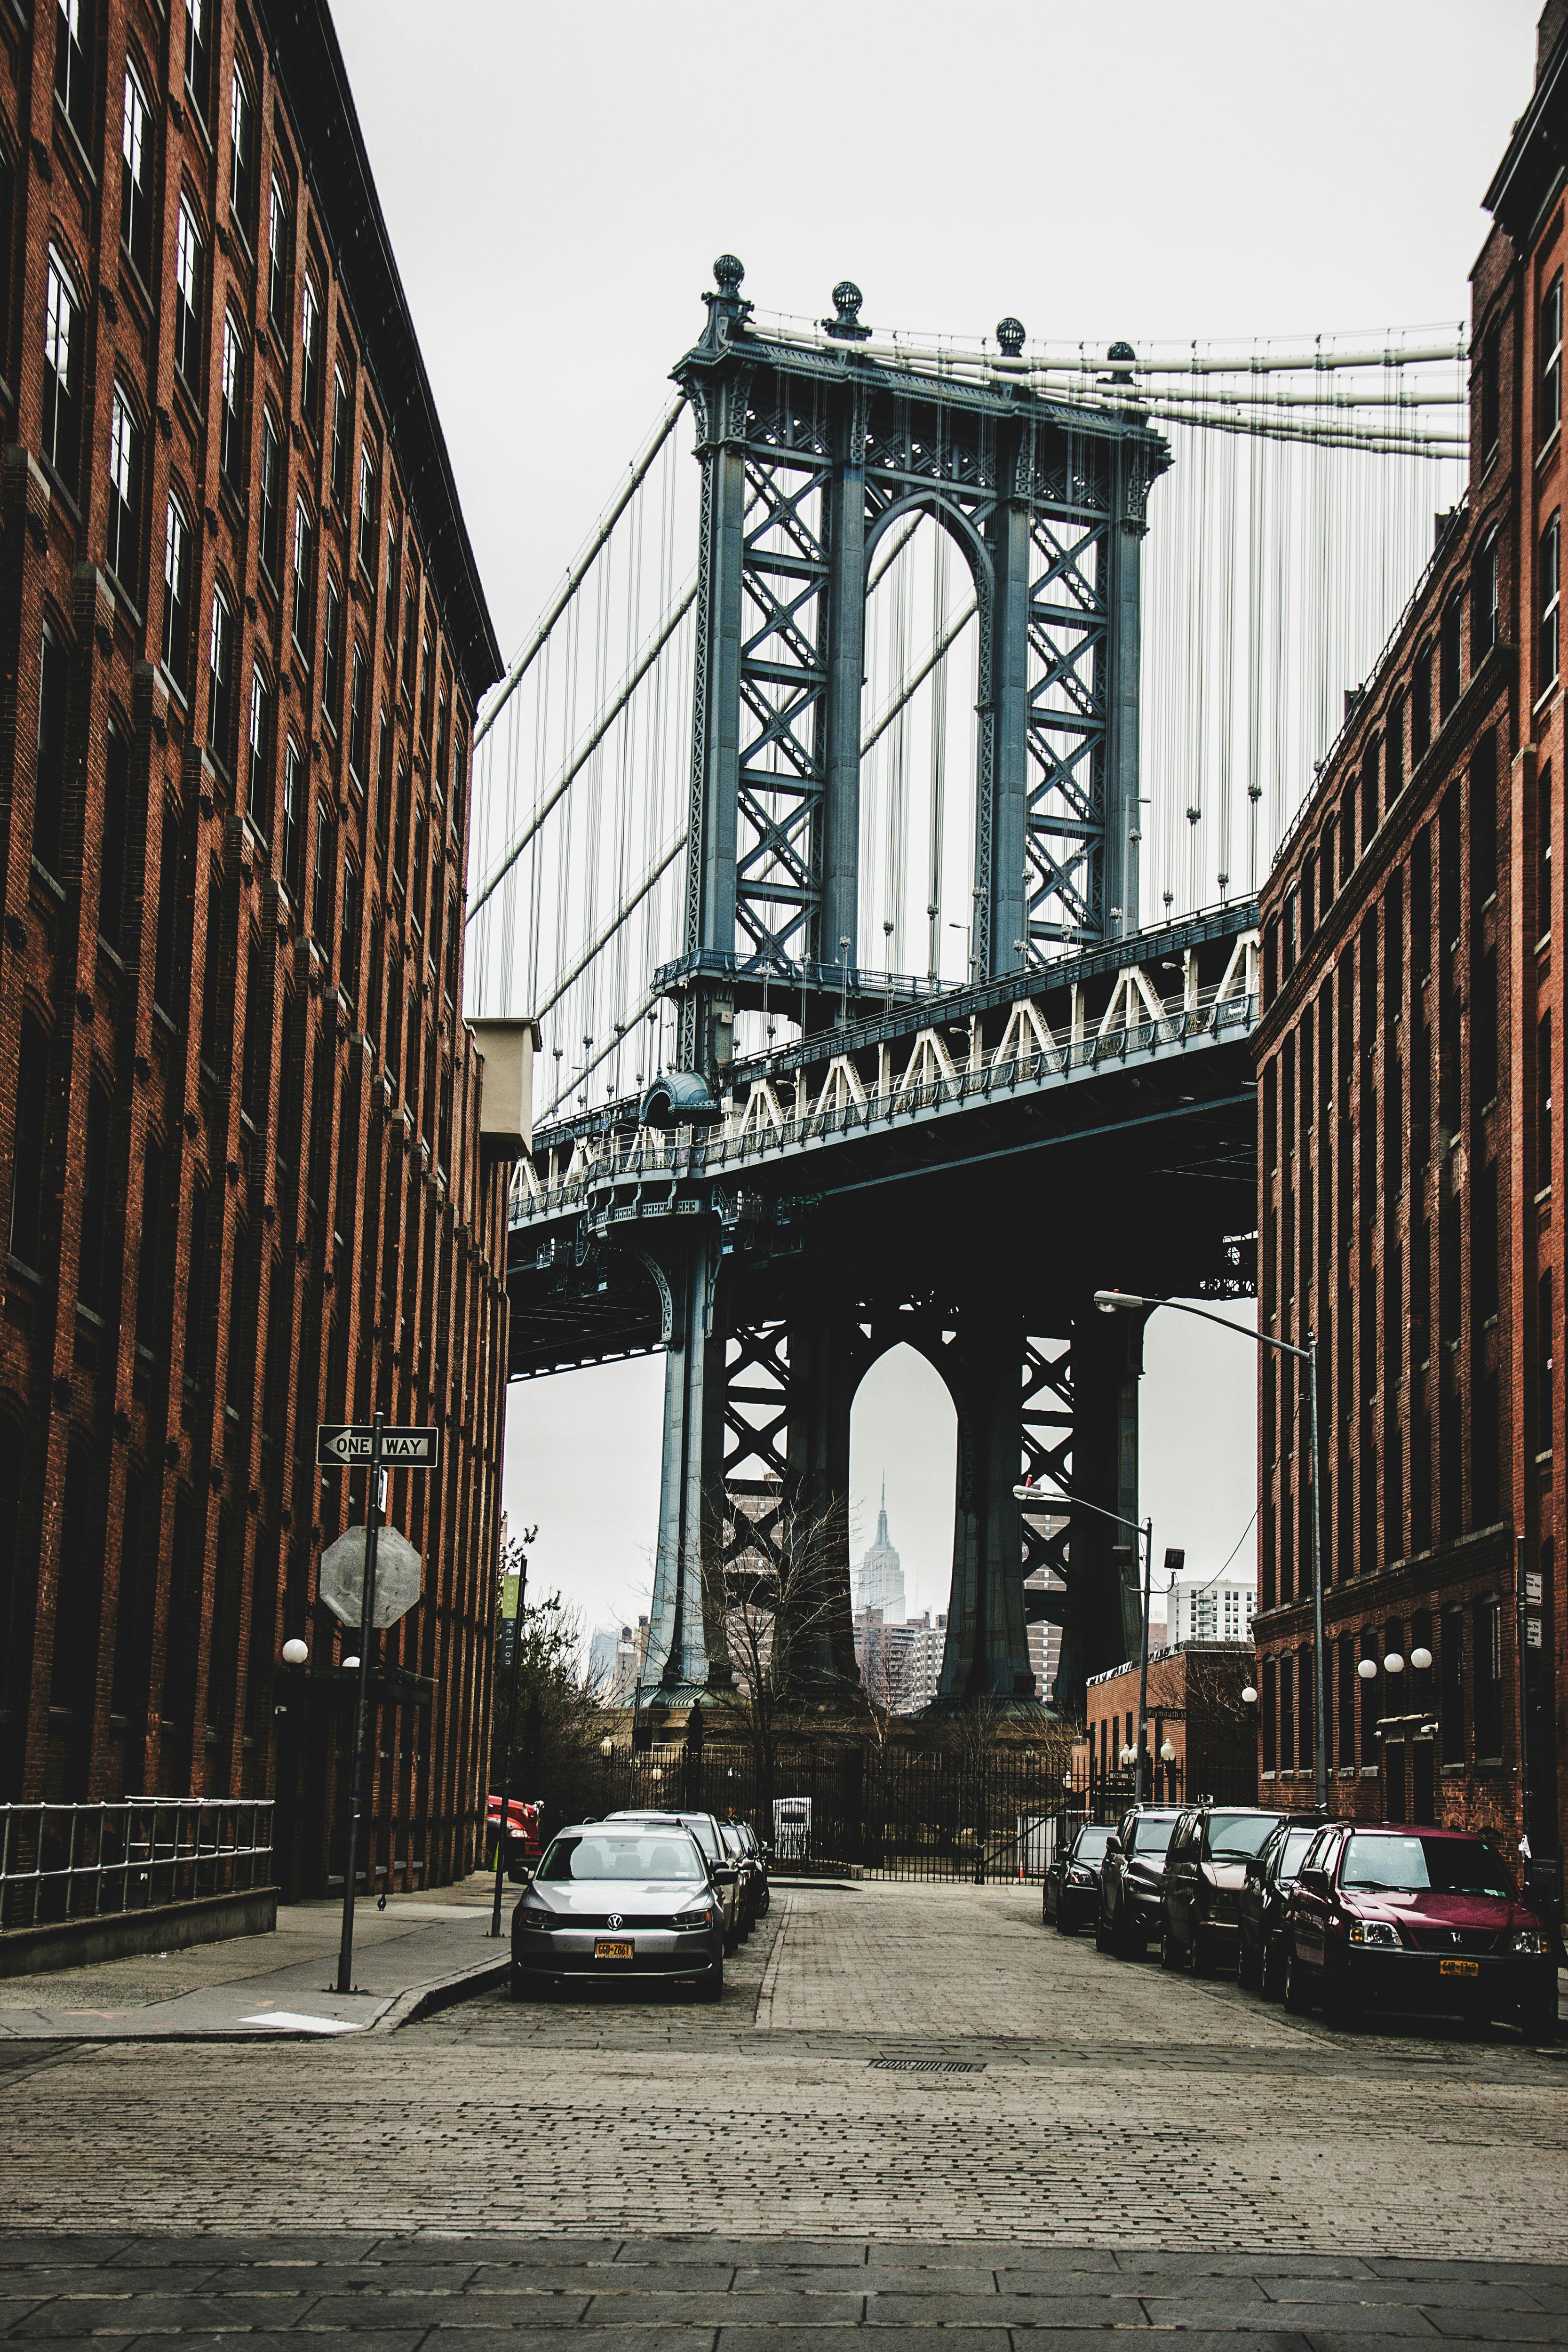
Ralph Lauren Corporation was founded in 1967 and is headquartered in New York, New York.

Show Full description

1.b. Last Insights on RL

Ralph Lauren Corporation's recent performance was driven by strong execution and sales growth, with double-digit comp sales growth across segments. The company's brand elevation strategy and pricing power have yielded positive results. Q2 revenue surged 17% year-over-year, with pro forma EPS rising 49% year-over-year. A robust balance sheet and premium margins have underpinned outperformance. Despite conservative guidance, the company consistently beats expectations. Its Q3 earnings revealed a 10% revenue growth, with Asia revenue growing 22%. However, tariff-driven margin outlook pressured shares.

1.c. Company Highlights

2. Ralph Lauren Delivers Strong Q3 Results

Ralph Lauren Corporation reported a robust third quarter, with revenue growth of 10% exceeding the company's initial expectations. The adjusted gross margin expanded 140 basis points to 69.8%, driven by Average Unit Retail (AUR) growth, favorable mix shift, and lower cotton costs. AUR grew 18% in the third quarter, supported by strong full-price selling trends and reduced discounting. Adjusted operating margin expanded 200 basis points to 20.7%, and operating profit increased 21%. Earnings per share (EPS) came in at $5.79, slightly below analyst estimates of $5.8.

Publication Date: Feb -06

📋 Highlights
  • Revenue Growth Acceleration:: Q3 revenue surged 10%, outperforming mid-single-digit guidance, with Asia leading at 22% growth driven by 30%+ sales increase in China.
  • Gross Margin Expansion:: Adjusted gross margin widened 140 bps to 69.8%, fueled by 18% AUR growth, favorable mix shifts, and reduced discounting.
  • Operating Margin Strength:: Adjusted operating margin expanded 200 bps to 20.7%, with operating profit rising 21% despite 9% higher marketing spend.
  • Digital Ecosystem Growth:: Total digital sales grew mid-teens, led by Asia, while Europe's digital ecosystem rose low double digits despite softer outlet trends.
  • Full-Year Guidance Raised:: Revenue outlook lifted to high single to low double-digit growth (from 5-7%), with operating margin expected to expand 100-140 bps in constant currency.

Regional Performance

The company's performance was balanced across regions, with Asia leading the growth at 22%, driven by strong full-price demand and high-impact brand engagement. Europe also delivered healthy growth, with revenue increasing 8% above the company's plan, driven by higher-than-expected reorders. North America's performance was in line with expectations, with retail comps growing in the high single-digit range.

Valuation and Outlook

Given the strong Q3 results and upgraded full-year guidance, we examine the company's valuation metrics. The current P/E Ratio stands at 22.53, indicating that the stock may be slightly overvalued. However, the ROE of 34.74% and ROIC of 18.56% suggest strong profitability. The company's outlook remains positive, with expected constant currency revenues to increase high single to low double digits for fiscal 2026, up from 5% to 7% previously. Analysts estimate next year's revenue growth at 5.8%, which is relatively in line with the company's guidance.

Margin and Cash Flow

The company's adjusted operating margin expansion was driven by a more balanced contribution of margin expansion and expense leverage. Gross margin is expected to expand about 40 to 80 basis points for the full year, with further growth in AUR and favorable cotton and full-price channel mix. Ralph Lauren ended the period with $2.3 billion in cash and short-term investments, and $1.2 billion in total debt, indicating a healthy cash position.

3. NewsRoom

Card image cap

Two AI Stocks, Ralph Lauren Lead Five Stocks To Watch Near Buy Points

Feb -21

Card image cap

Micron & 2 More Profitable Stocks to Buy Now for Big Gains

Feb -19

Card image cap

Best Growth Stocks to Buy for February 18th

Feb -18

Card image cap

The Zacks Analyst Blog Ralph Lauren, Roku, Airbnb, FOX and Carnival

Feb -18

Card image cap

Buy 5 Consumer Discretionary Stocks Despite the Sector's Recent Slump

Feb -17

Card image cap

Consumer Sentiment Hits 6-Month High: 4 Discretionary Stocks to Buy

Feb -13

Card image cap

RL's Margin Expansion Story: Is Full-Price Demand the Key Driver?

Feb -12

Card image cap

Ralph Lauren Corporation $RL Shares Acquired by Baader Bank Aktiengesellschaft

Feb -12

4. Business Breakdown

4.a. Revenues by Country

4.b. Revenues by Segment

5. Expected revenues mid-term growth (3.98%)

6. Segments

North America

Expected Growth: 4.0%

Ralph Lauren's 4.0% growth in North America is driven by strong brand recognition, increased online sales, and strategic wholesale partnerships. The region's recovering economy and consumer spending also contribute to growth. Additionally, the company's focus on digital marketing, product innovation, and targeted promotions have helped to drive sales and expand market share.

Europe

Expected Growth: 3.8%

Ralph Lauren's 3.8% growth in Europe is driven by a strong brand reputation, increased tourism, and a growing demand for luxury goods. The region's economic recovery, coupled with the company's strategic investments in e-commerce and digital marketing, have also contributed to this growth. Additionally, the brand's focus on sustainability and diversity has resonated with European consumers, further boosting sales.

Asia

Expected Growth: 4.2%

Asia's 4.2% growth for Ralph Lauren Corporation is driven by increasing brand awareness, expanding e-commerce presence, and strategic partnerships. Growing middle-class populations in China, Japan, and South Korea are driving demand for luxury goods. Additionally, the company's focus on digital marketing and social media is resonating with Asian consumers, contributing to the region's growth.

Other Non-reportable Segments

Expected Growth: 3.5%

Ralph Lauren's Other Non-reportable Segments' 3.5% growth is driven by strategic brand extensions, increased licensing agreements, and expansion into new markets. Additionally, the company's focus on digital transformation, e-commerce growth, and operational efficiencies have contributed to this growth. Furthermore, the segment has benefited from the company's efforts to optimize its supply chain and improve product offerings.

7. Detailed Products

Polo Shirts

Classic, high-quality polo shirts with the iconic Polo logo, available in a range of colors and styles for men, women, and children.

Dress Shirts

Luxurious, high-quality dress shirts with a focus on comfort, style, and attention to detail, available in a range of fabrics and styles.

Denim

High-quality denim jeans, jackets, and shorts for men and women, with a focus on comfort, style, and durability.

Outerwear

Luxurious, high-quality outerwear, including coats, jackets, and blazers, designed to keep you warm and stylish.

Dresses

Elegant, high-quality dresses for women, available in a range of styles, fabrics, and colors.

Accessories

High-quality accessories, including hats, scarves, belts, and bags, designed to complement Ralph Lauren's clothing lines.

Home Furnishings

Luxurious, high-quality home furnishings, including bedding, towels, and decorative items, designed to bring the Ralph Lauren style into your home.

Fragrances

High-quality fragrances for men and women, designed to evoke the essence of the Ralph Lauren lifestyle.

8. Ralph Lauren Corporation's Porter Forces

Forces Ranking

Threat Of Substitutes

Ralph Lauren Corporation faces moderate threat from substitutes, as consumers have various alternatives for luxury apparel and accessories. However, the brand's strong reputation and quality products mitigate this threat to some extent.

Bargaining Power Of Customers

Ralph Lauren Corporation's customers have relatively low bargaining power due to the company's strong brand image and premium pricing strategy. This limits customers' ability to negotiate prices or demand customized products.

Bargaining Power Of Suppliers

Ralph Lauren Corporation's suppliers have moderate bargaining power, as the company relies on a diverse range of suppliers for raw materials and manufacturing services. However, the company's scale and reputation help maintain a balance of power.

Threat Of New Entrants

The luxury apparel and accessories market has high barriers to entry, making it challenging for new entrants to compete with established brands like Ralph Lauren Corporation. The company's strong brand recognition and distribution network also deter new entrants.

Intensity Of Rivalry

The luxury apparel and accessories market is highly competitive, with numerous established brands competing for market share. Ralph Lauren Corporation faces intense rivalry from brands like Gucci, Prada, and Louis Vuitton, which can lead to pricing pressures and advertising wars.

9. SWOT Analysis

10. Capital Structure

10.a. Balance Sheet

10.b. Weighted Average Cost of capital

Value
Debt Weight 36.45%
Debt Cost 3.95%
Equity Weight 63.55%
Equity Cost 11.75%
WACC 8.91%
Leverage 57.35%

11. Quality Control: Ralph Lauren Corporation passed 7 out of 9 key points

12.a Historical Valuation

12.b Price/Earnings Ratio

12.c Margin Valuation

12.d Peers Valuation

Peers Group Analysis

Stock-Card
Ralph Lauren

A-Score: 5.6/10

Value: 2.4

Growth: 6.1

Quality: 6.8

Yield: 3.0

Momentum: 9.0

Volatility: 6.3

1-Year Total Return ->

Stock-Card
Kontoor Brands

A-Score: 4.6/10

Value: 3.8

Growth: 4.0

Quality: 5.7

Yield: 7.0

Momentum: 3.0

Volatility: 4.3

1-Year Total Return ->

Stock-Card
Columbia Sportswear

A-Score: 4.6/10

Value: 5.7

Growth: 5.4

Quality: 6.2

Yield: 3.0

Momentum: 1.0

Volatility: 6.0

1-Year Total Return ->

Stock-Card
PVH

A-Score: 3.9/10

Value: 7.8

Growth: 4.4

Quality: 4.7

Yield: 0.0

Momentum: 2.5

Volatility: 4.0

1-Year Total Return ->

Stock-Card
Albany International

A-Score: 3.5/10

Value: 5.1

Growth: 4.8

Quality: 2.2

Yield: 3.0

Momentum: 1.0

Volatility: 5.0

1-Year Total Return ->

Stock-Card
Under Armour

A-Score: 3.2/10

Value: 7.5

Growth: 2.1

Quality: 4.2

Yield: 0.0

Momentum: 1.0

Volatility: 4.3

1-Year Total Return ->

Peers Metrics

12.e Scoring Insights

12.f DCF BETA

Parameters

Short Term Growth

Short term Time

Long-Term Growth

WACC

Target Price

385.03$

Current Price

385.03$

Potential

-0.00%

Expected Cash-Flows