Company Story
1978 - Hikma Pharmaceuticals PLC was founded in Jordan by Samih Darwazah.
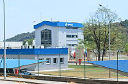
1980 - The company started manufacturing operations in Jordan.
1990 - Hikma expanded its operations to the Middle East and North Africa.
1996 - The company listed on the London Stock Exchange.
2000 - Hikma acquired Amdipharm, a UK-based pharmaceutical company.
2005 - The company expanded its operations to the United States.
2010 - Hikma acquired Baxter's injectables business.
2015 - The company acquired Roxane Laboratories, a US-based pharmaceutical company.
2016 - Hikma acquired a 51% stake in the Egyptian pharmaceutical company, EIPICO.
2017 - The company acquired a 33.33% stake in the Saudi Arabian pharmaceutical company, Jazeera Pharmaceuticals.