Company Story
1976 - Apple Computer founded by Steve Jobs, Steve Wozniak, and Ronald Wayne
1977 - Apple I, one of the first personal computers, is introduced
1978 - Apple II, one of the first highly successful mass-produced personal computers, is introduced
1980 - Apple goes public with an initial public offering (IPO)
1984 - Macintosh 128k, the original Macintosh computer, is introduced
1985 - Steve Jobs leaves Apple after a power struggle with John Sculley
1996 - Apple acquires NeXT, and Steve Jobs returns to Apple
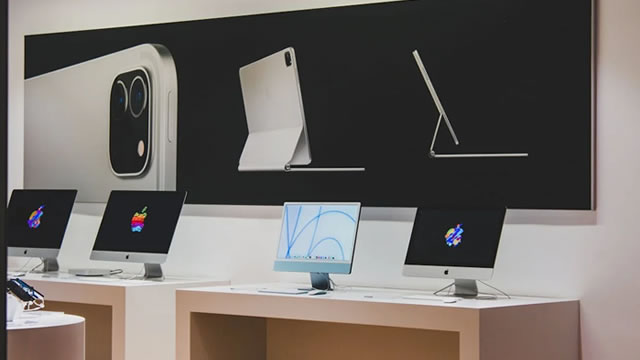
1998 - iMac, a line of all-in-one desktop computers, is introduced
2001 - Apple introduces the iPod, a portable music player
2007 - iPhone, a revolutionary smartphone, is introduced
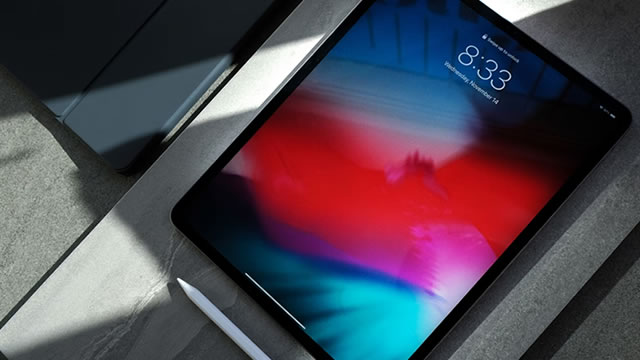
2010 - iPad, a line of tablet computers, is introduced
2011 - Steve Jobs passes away after a long battle with pancreatic cancer
2014 - Apple acquires Beats Electronics, a headphones and music streaming company