1.25%
-8.57%
-28.39%
-10.11%
-47.73%
-68.14%
-38.38%

Company Description

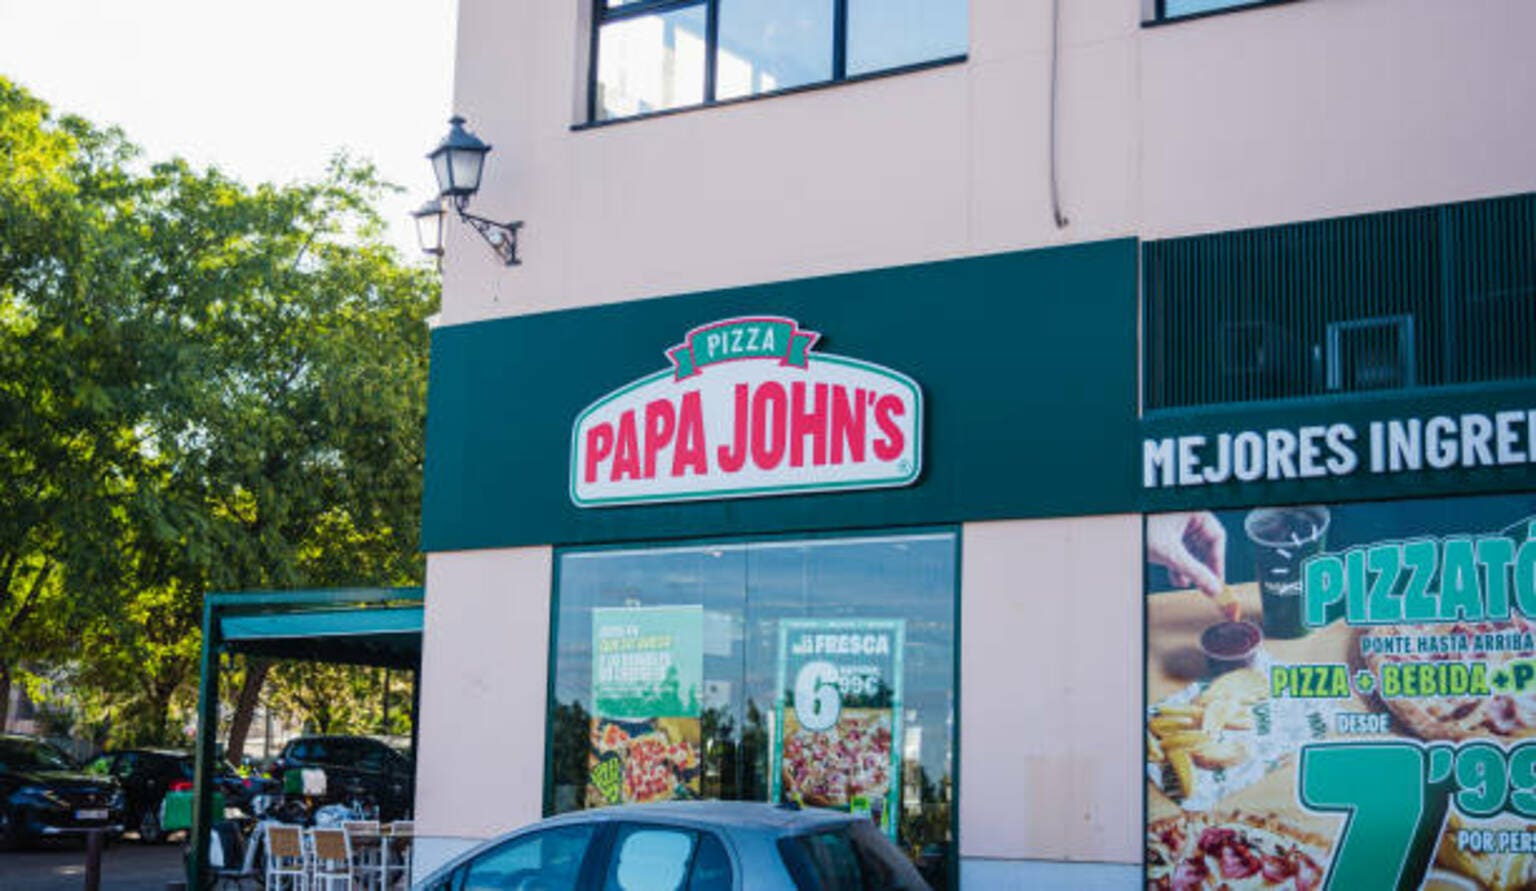
Papa John's International, Inc.operates and franchises pizza delivery and carryout restaurants under the Papa John's trademark in the United States and internationally.It operates through four segments: Domestic Company-Owned Restaurants, North America Commissaries, North America Franchising, and International Operations.


The company also operates dine-in and delivery restaurants under the Papa John's trademark internationally.As of December 26, 2021, it operated 5,650 Papa John's restaurants, which included 600 company-owned and 5,050 franchised restaurants in 50 countries and territories.The company was founded in 1984 and is based in Louisville, Kentucky.

Market Data

Last Price 39.57
Change Percentage 1.25%
Open 39.08
Previous Close 39.08
Market Cap ( Millions) 1292
Volume 1055259
Year High 76.91
Year Low 35.28
M A 50 43.23
M A 200 48.29

Financial Ratios

FCF Yield 3.82%
Dividend Yield 4.65%
ROE -21.09%
Debt / Equity -231.51%
Net Debt / EBIDTA 378.38%
Price To Book -3.12
Price Earnings Ratio 13.67
Price To FCF 26.17
Price To sales 0.62
EV / EBITDA 8.97

News

Business Breakdown

Expected Mid-Term Growth

Segment nΒ°1 -> North America Commissaries

Expected Growth : 2.5 %

What the company do ?

North America Commissaries from Papa John's International, Inc. refers to the company's food production and distribution centers that supply ingredients and prepared food products to its franchisees and corporate-owned restaurants in North America.

Why we expect these perspectives ?

Papa John's North America Commissaries' 2.5% growth driven by increasing demand for convenience and quality food, expansion of online ordering and delivery services, and strategic partnerships with third-party aggregators. Additionally, the company's focus on menu innovation, marketing efforts, and operational efficiencies contribute to the growth.

Segment nΒ°2 -> Domestic Company-owned Restaurants

Expected Growth : 1.8 %

What the company do ?

Domestic Company-owned Restaurants from Papa John's International, Inc. refers to the pizza restaurants owned and operated by Papa John's in the United States.

Why we expect these perspectives ?

Papa John's domestic company-owned restaurants' 1.8% growth is driven by increased same-store sales, successful marketing campaigns, and strategic menu pricing. Additionally, the company's focus on digital transformation, including online ordering and mobile app enhancements, has contributed to the growth. Furthermore, the brand's efforts to improve customer experience and loyalty programs have also positively impacted sales.

Segment nΒ°3 -> All Others

Expected Growth : 1.2 %

What the company do ?

All Others from Papa John's International, Inc. refers to the company's revenue generated from sales of other products and services, excluding pizza, online and mobile ordering fees, and other revenue streams.

Why we expect these perspectives ?

All Others segment from Papa John's International, Inc. grew 1.2% driven by increased sales from online ordering and mobile apps, expansion of delivery services, and strategic partnerships. Additionally, the company's focus on digital marketing and customer loyalty programs contributed to the growth.

Segment nΒ°4 -> International

Expected Growth : 2.2 %

What the company do ?

Papa John's International, Inc. is a global pizza restaurant chain with over 5,000 locations in 45 countries, offering a variety of pizzas and sides.

Why we expect these perspectives ?

Papa John's International, Inc.'s 2.2% international growth is driven by increasing demand for convenience food, expansion into new markets, and strategic partnerships. Additionally, the company's focus on digital transformation, menu innovation, and customer experience enhancements are contributing to its growth momentum.

Segment nΒ°5 -> North America Franchising

Expected Growth : 2.8 %

What the company do ?

North America Franchising from Papa John's International, Inc. offers a business model for entrepreneurs to operate Papa John's pizza restaurants in the US and Canada.

Why we expect these perspectives ?

Papa John's North America Franchising growth of 2.8% is driven by increasing same-store sales, expansion of digital ordering capabilities, and strategic marketing efforts. Additionally, the company's focus on improving customer experience, menu innovation, and loyalty programs contribute to the growth. Furthermore, the brand's reputation for quality and convenience also supports the segment's growth.

Papa John'S International, Inc. Products

Product Range What is it ?
Papa John's Pizza Hand-tossed, fresh, and high-quality pizzas made with 100% real cheese and a variety of toppings
Sides Variety of sides including garlic knots, breadsticks, and chicken wings
Desserts Sweet treats like chocolate chip cookies and brownies
Beverages Soft drinks, iced tea, and bottled water
Delivery and Carryout Convenient delivery and carryout options for customers
Catering Customizable catering options for events and parties

Papa John's International, Inc.'s Porter Forces

Papa John's faces moderate threat from substitutes as customers have various alternatives for pizza, including cooking at home, ordering from other restaurants, or purchasing pre-made pizzas from grocery stores.

Papa John's customers have high bargaining power due to the competitive nature of the pizza industry, allowing them to easily switch to competitors if they are not satisfied with the product or service.

Papa John's suppliers have low bargaining power due to the company's large scale of operations and ability to negotiate favorable prices with suppliers.

The threat of new entrants is low for Papa John's due to the high barriers to entry in the pizza industry, including the need for significant capital investment and established brand recognition.

The intensity of rivalry in the pizza industry is high, with Papa John's competing against established brands such as Domino's and Pizza Hut, as well as smaller, regional players.

Capital Structure

Value
Debt Weight 238.52%
Debt Cost 5.80%
Equity Weight -138.52%
Equity Cost 9.73%
WACC 0.36%
Leverage -172.19%

Historical Valuation

Price/Earnings Ratio

Margin Valuation

Peers Valuation

Competitors

Company Rational
CAKE The Cheesecake Factory Incorporated operates restaurants. It operates two bakeries that produces cheesecakes and other baked products for its restaurants, international licensees, third-party bakery customers, external foodservice operators, retailers, and …
FAT FAT Brands Inc., a multi-brand franchising company, acquires, develops, and manages quick service, fast casual, casual dining, and polished casual dining restaurant concepts worldwide. As of August 22, 2022, it …
JACK Jack in the Box Inc. operates and franchises Jack in the Box quick-service restaurants. As of November 23, 2021, it operated and franchised approximately 2,200 Jack in the Box quick-service …
BLMN Bloomin' Brands, Inc., through its subsidiaries, owns and operates casual, upscale casual, and fine dining restaurants in the United States and internationally. The company operates through two segments, U.S. and …
LOCO El Pollo Loco Holdings, Inc., through its subsidiary, El Pollo Loco, Inc., develops, franchises, licenses, and operates quick-service restaurants under the El Pollo Loco name. As of May 04, 2022, …

Peers Metrics

DCF BETA

Parameters

Short Term Growth
Short term Time
Long-Term Growth
WACC
Target Price
39.57$
Current Price
39.57$
Potential
0.00%

Expected Cash-Flows

Scoring Insights

Peers Group Analysis

πŸ₯‡

El Pollo Loco Logo
El Pollo Loco
A-Score # N/A

Value:# N/A

Growth: # N/A

Quality: # N/A

Yield: # N/A

Momentum: # N/A

Volatility: # N/A

1-Year Total Return ->

πŸ₯ˆ

FAT Brands Logo
FAT Brands
A-Score # N/A

Value:# N/A

Growth: # N/A

Quality: # N/A

Yield: # N/A

Momentum: # N/A

Volatility: # N/A

1-Year Total Return ->

πŸ₯‰

Jack in the Box Logo
Jack in the Box
A-Score # N/A

Value:# N/A

Growth: # N/A

Quality: # N/A

Yield: # N/A

Momentum: # N/A

Volatility: # N/A

1-Year Total Return ->

4

Papa John's Logo
Papa John's
A-Score # N/A

Value:# N/A

Growth: # N/A

Quality: # N/A

Yield: # N/A

Momentum: # N/A

Volatility: # N/A

1-Year Total Return ->

5

The Cheesecake Factory Logo
The Cheesecake Factory
A-Score # N/A

Value:# N/A

Growth: # N/A

Quality: # N/A

Yield: # N/A

Momentum: # N/A

Volatility: # N/A

1-Year Total Return ->

6

Bloomin Brands Logo
Bloomin Brands
A-Score # N/A

Value:# N/A

Growth: # N/A

Quality: # N/A

Yield: # N/A

Momentum: # N/A

Volatility: # N/A

1-Year Total Return ->