Company Story
1964 - University of Oregon track coach Bill Bowerman and his former University of Oregon student Phil Knight founded Blue Ribbon Sports, which operated as a distributor for the Japanese shoe maker Onitsuka Tiger.
1966 - BRS opened its first retail store at Santa Monica, California.
1971 - BRS was renamed Nike, Inc. after the Greek goddess of victory.
1972 - Nike debuted its first product line, which included the iconic Cortez running shoe.
1980 - Nike signed its first endorsement contract with tennis player Ilie Nastase.
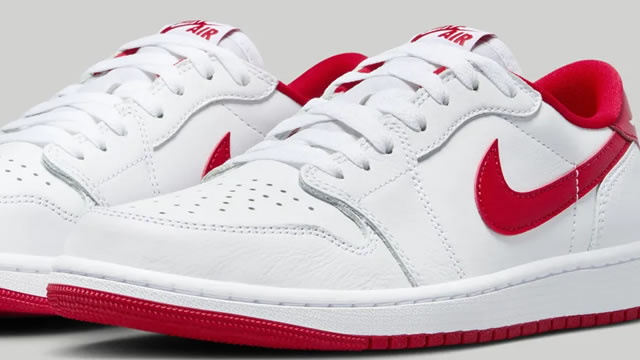
1985 - Nike signed a five-year endorsement contract with basketball player Michael Jordan, which led to the creation of the Air Jordan brand.
1990 - Nike expanded globally, opening offices in Europe, Asia, and Latin America.
1996 - Nike launched its first e-commerce website.
2003 - Nike acquired Converse, Inc. for $309 million.
2008 - Nike launched its 'Just Do It' campaign, which became one of the most recognizable slogans in advertising.
2015 - Nike launched its digital sports platform, Nike SNKRS.