Company Story
2013 - Robinhood Markets, Inc. was founded by Baiju Bhatt and Vladimir Tenev.
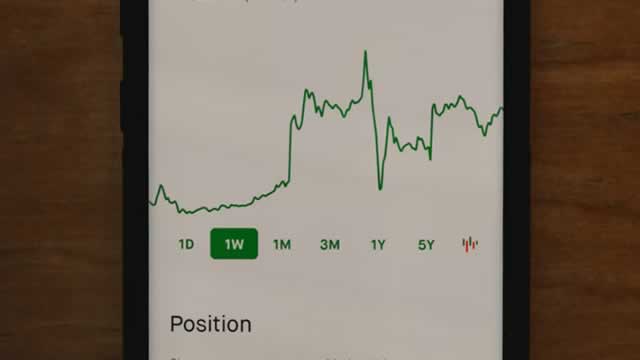
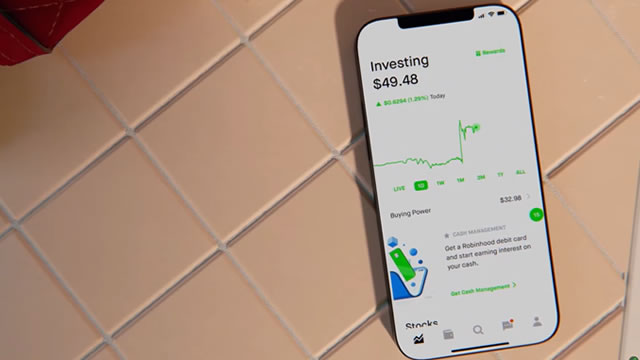
2014 - Robinhood launched its mobile app, allowing users to buy and sell stocks with no commission fees.
2015 - Robinhood raised $50 million in funding from investors, valuing the company at $1.3 billion.
2017 - Robinhood introduced options trading, allowing users to buy and sell options contracts.
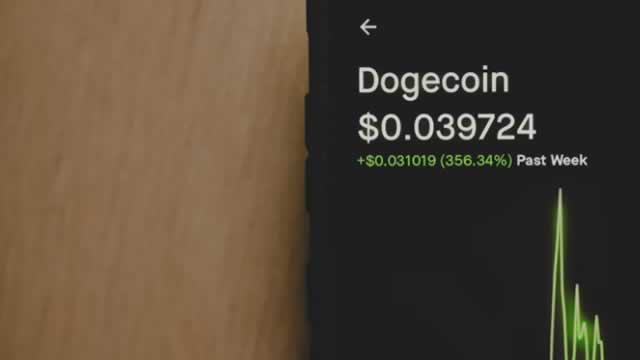
2018 - Robinhood launched Robinhood Crypto, allowing users to buy and sell cryptocurrencies like Bitcoin and Ethereum.
2019 - Robinhood raised $323 million in funding, valuing the company at $7.6 billion.
2020 - Robinhood launched its initial public offering (IPO), listing on the NASDAQ stock exchange under the ticker symbol HOOD.
2021 - Robinhood expanded its offerings to include cash management and debit cards, allowing users to earn interest on their uninvested cash.