Company Story
2009 - Rivian Automotive, Inc. was founded by R.J. Scaringe.
2015 - Rivian raised $122 million in funding from investors, including a $100 million investment from Sumitomo Corporation.
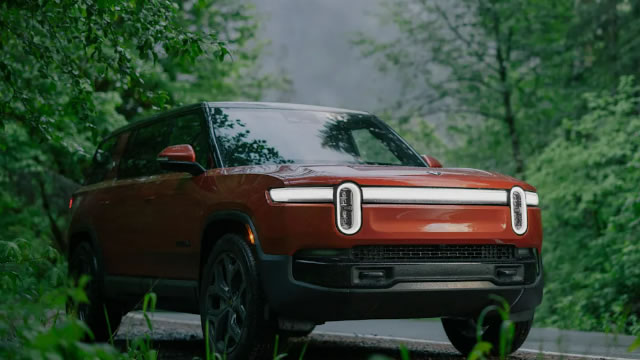
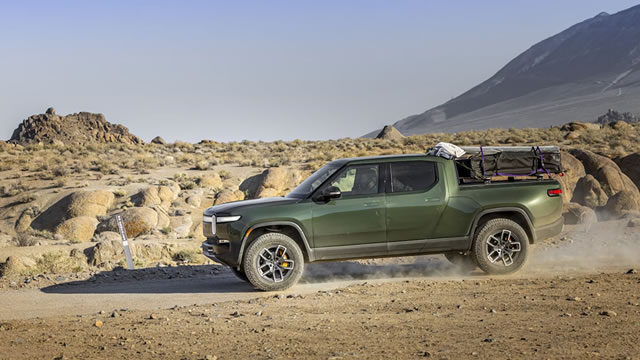
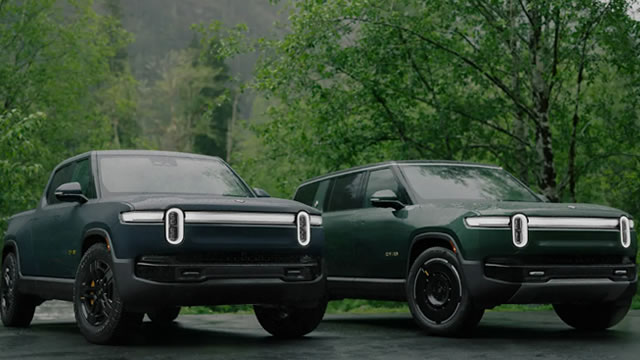
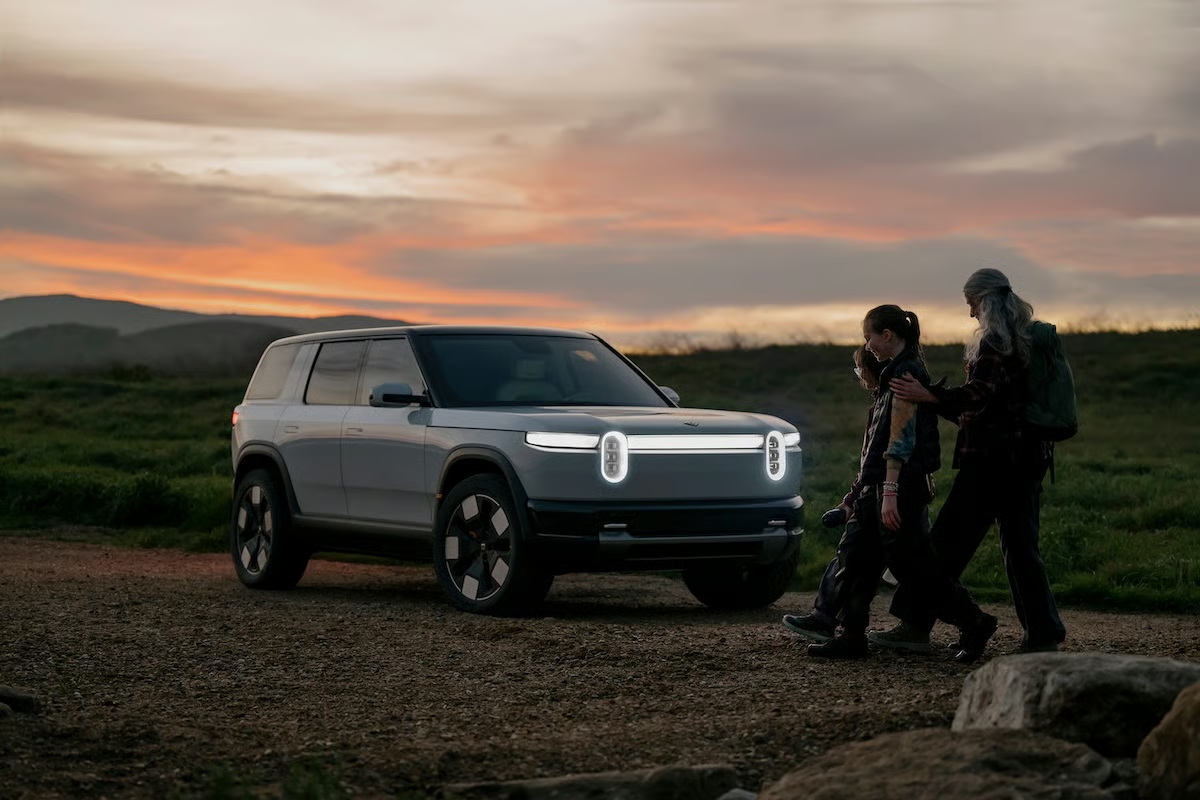
2018 - Rivian unveiled its first two products, the R1T electric pickup truck and the R1S electric SUV, at the Los Angeles Auto Show.
2019 - Rivian raised $700 million in funding from investors, including Amazon, Ford, and T. Rowe Price.
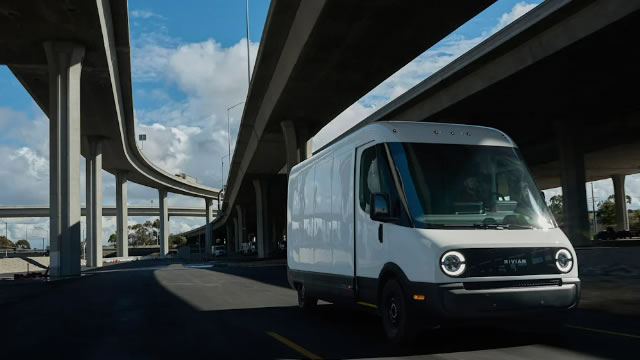
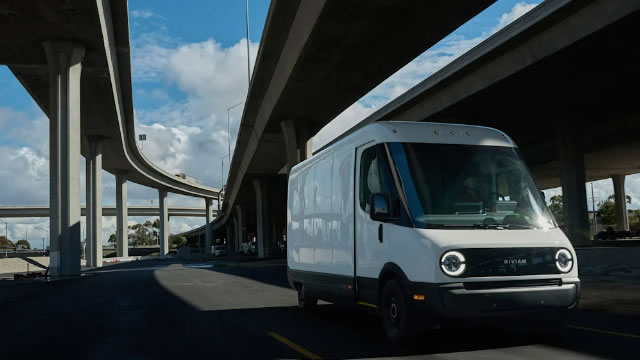
2020 - Rivian announced a partnership with Amazon to develop 100,000 electric delivery vans.
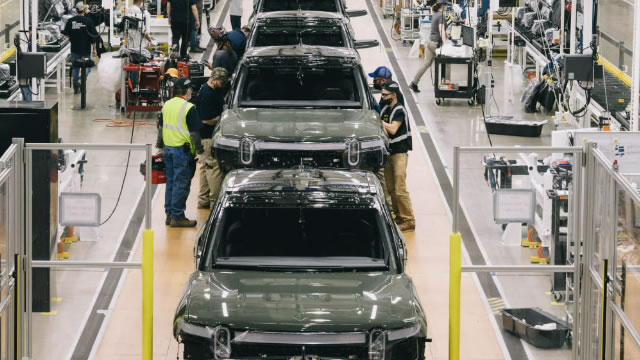
2021 - Rivian started production of the R1T electric pickup truck at its factory in Normal, Illinois.
2022 - Rivian announced plans to build a second factory in Georgia, with a planned production capacity of 400,000 vehicles per year.